Week 2: A Brief Overview

January 29, 2015

Updates & Questions

Are you comfortable with:

  • Knowledge Forum
  • Social media
  • ???

Any updates on interests in SIGs and WGs?

Readings

  • Siemens, G. (2013). Learning Analytics: The Emergence of a Discipline. American Behavioral Scientist, 0002764213498851. doi:10.1177/0002764213498851
  • Shum, S. B. (2012). UNESCO Policy Brief: Learning Analytics. Technical Report, UNESCO Institute for Information Technologies in Education.

A lot more curated by you!

A Recap of Discussed Issues

  • Techniques vs. Application
  • Cross levels (micro, meso, macro)
  • Implementing LA
  • Empowering learning

    • of vs. for
    • “leading to reflection, collaboration, linking ideas…”
    • learner control
  • Discourse analytics

    • vs. content analysis
    • concrete examples
  • LA and pedagogy!

Twitter Analytics: A Demo

Chen, B., Chen, X, & Xing, W. (in press). “Twitter Archeology” of Learning Analytics and Knowledge Conferences. In Proceedings of the 5th Learning Analytics and Knowledge Conference (LAK15).

Basic Logic of Data Analytics

Data Analytics Life Cycle

Source

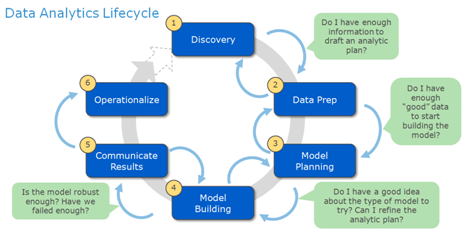
Data Analytics Life Cycle (cont'd)

Data Analytics Lifecycle

Methodological Dimensions

  1. Theoretical assumptions
  2. Purpose of analysis
  3. Units of action, interaction, and analysis
  4. Representations
    • What representations of data and representations of analytic constructs and interpretati ons capture these units in a manner consistent with the purposes and theoretical assumptions?
  5. Analytic manipulations

(From Productive Multivocality in the Analysis of Group Interactions, ch. 2)

In This Demo...

Before the actual analysis

  • Theoretical assumptions
  • Purposes of analysis

Analysis of Twitter data

  • Capture the data
  • Data prep / cleaning
  • Data exploration
  • Data manipulation and analysis
  • Communicate results

1. Theoretical assumptions

  • Interactions on Twitter are “real” and meaningful
  • People tweeting about a conference reflect the make-up of the community

2. Purposes of analysis

  • Understand characteristics of Twitter participation at 4 years of LAK conferences
  • Track evolution of the LAK Twitter community, in terms of
    • # of participants
    • social interactions
    • influential figures
    • discussed topics

3. Capture the data

The “magical” Twitter Archiving Google Spreadsheet, TAGS by Martin Hawskey

A walkthrough of TAGS…

4. Data prep / cleaning (fun + not fun)

4. Data prep / cleaning

  • Merge multi-year data
    • Match variable (column) names
    • Unify timestamp format
    • Extract URLs
    • Parse retweet and reply interactions
    • Clean up user id/name inconsistency
  • Data sanity check

5. Data exploration

  • Load cleaned data
setwd("~/src/r/shinyapp/twitterytics-shiny/lak")
suppressMessages(library(dplyr))
df = tbl_df(read.csv("new_lak.csv"))
glimpse(df)
  • Exploration
  • (Reproducible Research!)

6. Data manipulation and analysis

R code walkthrough…

  • lak.Rmd
    • descriptive
    • “community flow”
  • sna.R
    • social network analysis
  • lda.R
    • topic modeling

7. Communicate results

Another hard part…

  • Choices: text, a table, a figure…
  • What was the question?
  • Is the presentation biased/distorted? (bonus)
  • (By the way, try to avoid Pie Charts, and 3D Pie Charts especially…)
  • Look for inspirations!

House Keeping

  • Week 3
    • A bit more reading
    • Competencies you wish to assess? How? Gaps?
    • A chance to present your case! (5 - 10 min)
  • SIG and WG signup by Week 5
  • KF clinic
    • Promising Ideas; Remarks
    • KF likes Chrome! (> Firefox > Internet Explorer)
    • Report issues in “Sandbox + KF Issues”
  • Course materials hosted on github.com/meefen/LA-UMN
    • Updated timeline, slides, etc.

Make announcements: ci5330_002s15@umn.edu