Week 2 - A Brief Overview to Learning Analytics
Updates & Questions
Readings
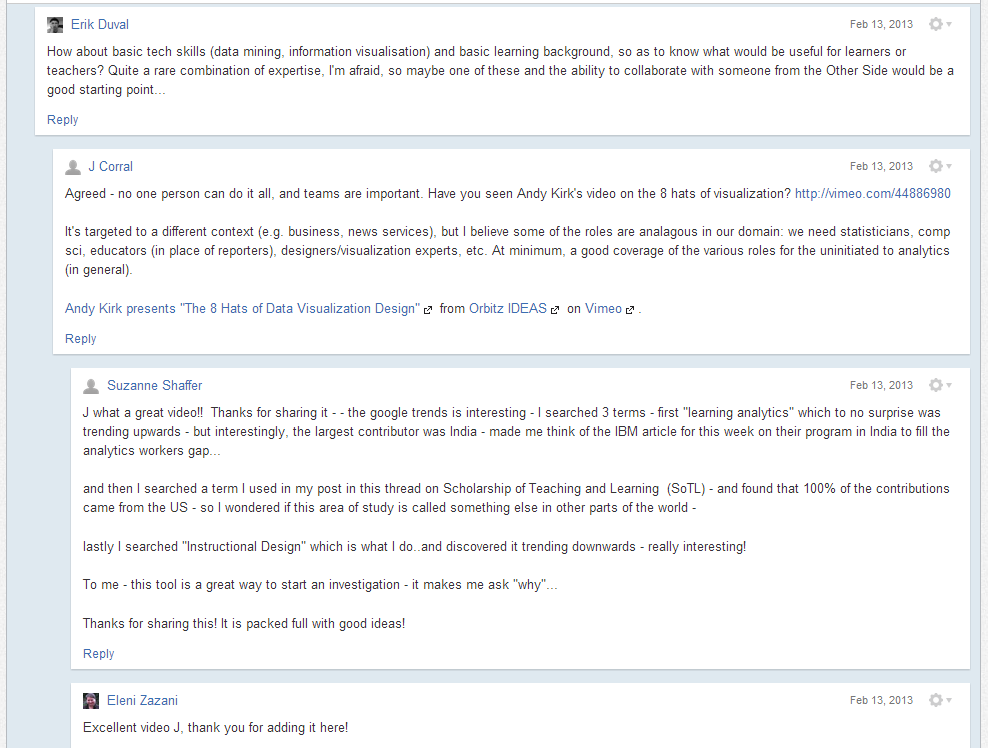
Reflection & Discussion
![]()
Learning analytics is the measurement, collection, analysis and reporting of data about learners and their contexts, for purposes of understanding and optimizing learning and the environments in which it occurs.
![]()
Learning analytics is the measurement, collection, analysis and reporting of data about learners and their contexts, for purposes of understanding and optimizing learning and the environments in which it occurs.
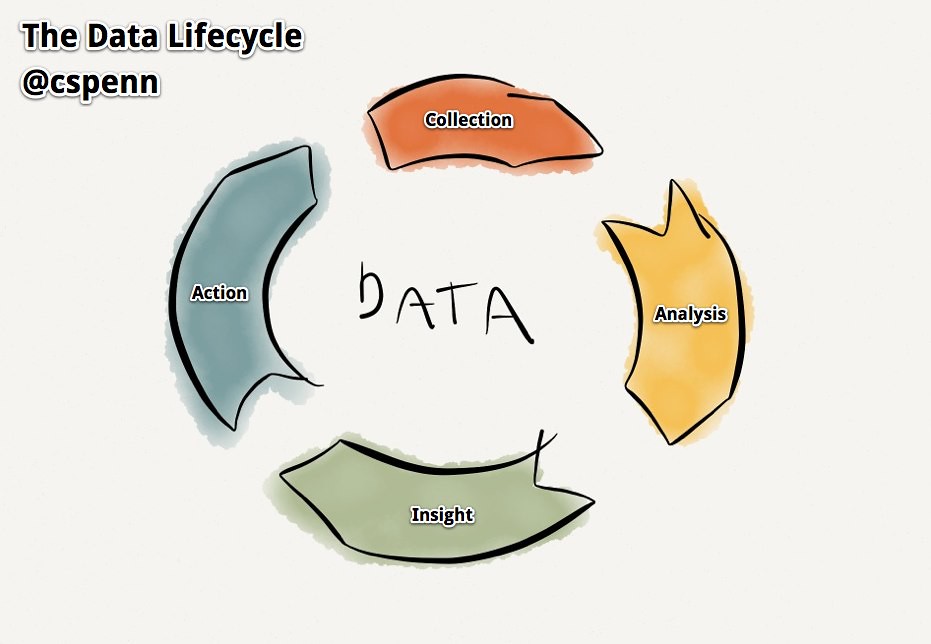
Data Analytics Lifecycle
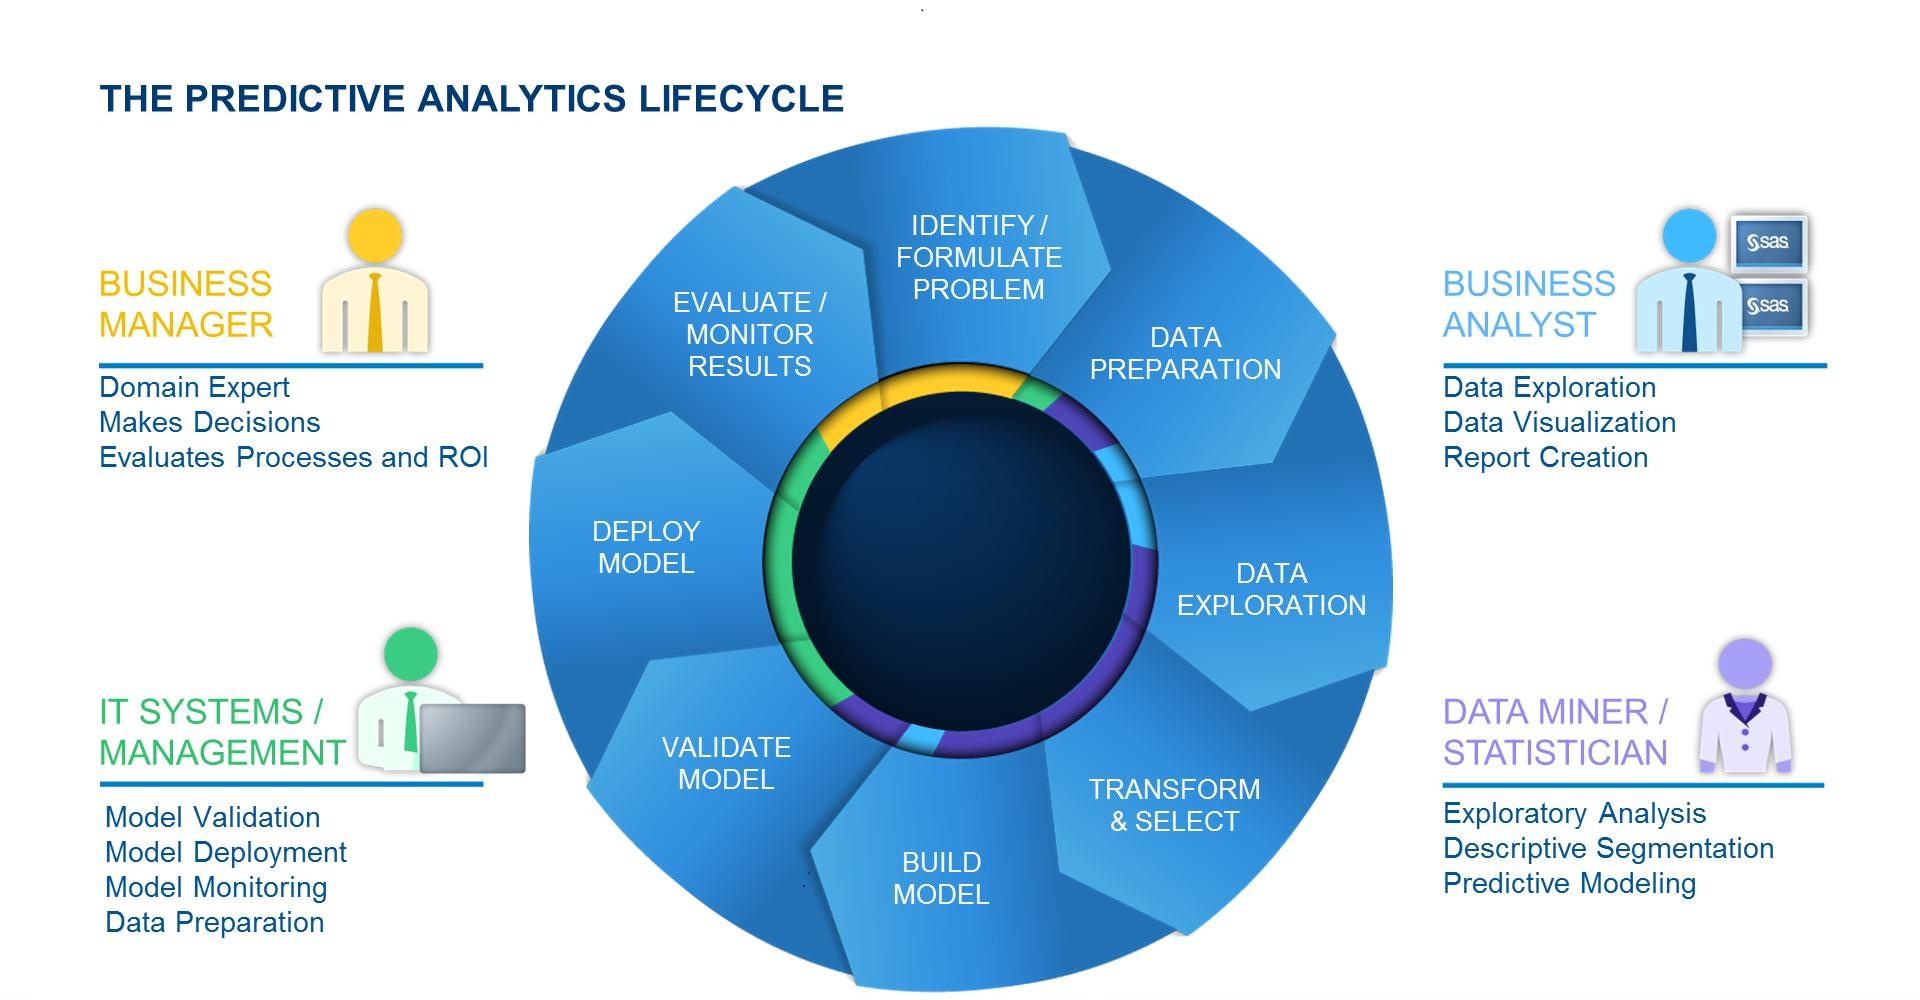
Data Analytics Lifecycle (predictive)
Methodological Dimensions
LA Model

CanvasNet as An Example...
Canvas: a rising Learning Management System (LMS)
CanvasNet: an analytics tool aiming to provide students with feedback on their social and conceptual engagement
Theoretical assumptions
Collection & acquisition
Collection & acquisition
Storage, cleaning & integration
- Google Sheet

- Not much cleaning or integration
Exploration & Analysis
- R (a statistical programming language)
- read data from Google Sheet
- social network analysis:
snaandigraphpackages - text analysis:
tmpackage


Representation & visualization

Representation & visualization (2)
